
Q2 2023 Update for Shareholders
FOR EXISTING SHAREHOLDERS ONLY
Q2 2023 Update for Shareholders
July 24, 2023
Dear BCRED Shareholder,
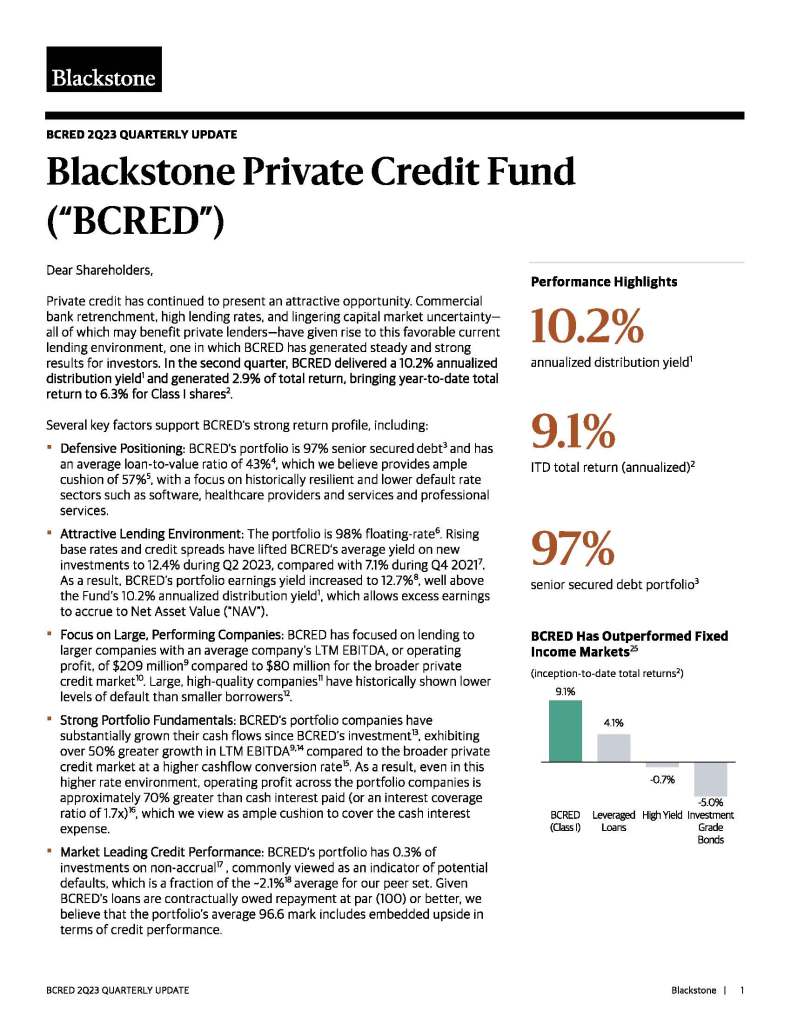
Private credit has continued to present an attractive opportunity. Commercial bank retrenchment, high lending rates, and lingering capital market uncertainty—all of which may benefit private lenders—have given rise to this favorable current lending environment, one in which BCRED has generated steady and strong results for investors. In the second quarter, BCRED delivered a 10.2% annualized distribution yield1 and generated 2.9% of total return, bringing year-to-date total return to 6.3% for Class I shares2.
BCRED Has Outperformed Fixed Income Markets25
Inception-to-date total returns2
Several key factors support BCRED’s strong return profile, including:
- Defensive Positioning: BCRED’s portfolio is 97% senior secured debt3 and has an average loan-to-value ratio of 43%4 , which we believe provides ample cushion of 57%5, with a focus on historically resilient and lower default rate sectors such as software, healthcare providers and services and professional services.
- Attractive Lending Environment: The portfolio is 98% floating-rate6. Rising base rates and credit spreads have lifted BCRED’s average yield on new investments to 12.4% during Q2 2023, compared with 7.1% during Q4 20217. As a result, BCRED’s portfolio earnings yield increased to 12.7%8, well above the Fund’s 10.2% annualized distribution yield1, which allows excess earnings to accrue to Net Asset Value (“NAV”).
- Focus on Large, Performing Companies: BCRED has focused on lending to larger companies with an average company’s LTM EBITDA, or operating profit, of $209 million9 compared to $80 million for the broader private credit market10. Large, high-quality companies11 have historically shown lower levels of default than smaller borrowers12.
- Strong Portfolio Fundamentals: BCRED’s portfolio companies have substantially grown their cash flows since BCRED’s investment13, exhibiting over 50% greater growth in LTM EBITDA9,14 compared to the broader private credit market at a higher cashflow conversion rate15. As a result, even in this higher rate environment, operating profit across the portfolio companies is approximately 70% greater than cash interest paid (or an interest coverage ratio of 1.7x)16, which we view as ample cushion to cover the cash interest expense.
- Market Leading Credit Performance: BCRED’s portfolio has 0.3% of investments on non-accrual17, commonly viewed as an indicator of potential defaults, which is a fraction of the ~2.1%18 average for our peer set. Given BCRED’s loans are contractually owed repayment at par (100) or better, we believe that the portfolio’s average 96.6 mark includes embedded upside in terms of credit performance.
Blackstone Credit endeavors to be the best credit manager, but we know the private credit space has attracted more players recently. In closing, we would like to remind our investors how BCRED, supported by Blackstone Credit as a manager, has differentiated itself.
First, power of the Blackstone platform. Being part of the world’s largest alternative asset management ecosystem allows BCRED access to Blackstone’s broad network, sourcing capabilities, and deep insights to support diligence. This powerful approach allows us to see broader and differentiated investment opportunities and be highly selective. During the first half of this year, Blackstone Credit only approved ~4% of the North America performing credit deals reviewed19. This selectivity helps drive a strong track record20,21 .
Second, value of size and scale. BCRED, as the largest BDC among its peer set by ~2x, is managed by the world’s largest credit manager at $295 billion of assets under management. This unprecedented scale distinguishes BCRED and has enabled BCRED to invest in larger, higher quality companies and maintain portfolio diversity. Blackstone Credit offers deep knowledge and insights investing in over 3,150 issuers22 and manages over $100 billion in liquid credit. This differentiated scale helps drive incremental deal flow, which led to over $10B of new private credit opportunities for BXC in 2021 and 2022.
And finally, breadth of value creation capabilities. Blackstone provides more than just capital to our portfolio companies. BCRED borrowers are offered full access to Blackstone Credit’s value creation network. We set ourselves apart with over 100 advisors23 and a dedicated team who can partner with portfolio companies to add value after BCRED makes a loan. Across the BXC platform, this has generated more than $500 million in enhanced revenues through cross-sell introductions, as well as $284 million in annual cost savings, resulting in the creation of over $3.4 billion of implied enterprise value24.
Investors in BCRED are not partnered with a general credit fund but rather partnered with the world’s largest and most established alternative asset manager. With the power of Blackstone’s platform and deep insights, differentiated scale and breadth of our capabilities, we select what we believe are attractive investment opportunities and partner with companies to enhance their value. Stronger companies are less likely to default. We view this as a win for BCRED and our investors, and it’s also a win for the companies and their sponsors, who tend to return with stronger businesses for us to consider. So the cycle continues.
Thank you for your trust in our platform, our process, and our team.

Brad Marshall
Chairman of the Board & Co-Chief Executive Officer

Jonathan Bock
Co-Chief Executive Officer

Carlos Whitaker
President

Teddy Desloge
Chief Financial Officer

Kate Rubenstein
Chief Operating Officer

Matt Alcide
Chief Accounting Officer

Stacy Wang
Head of Stakeholder Relations

Kris Corbett
Controller and Treasurer

Marisa Beeney
Chief Legal Officer

William Renahan
Chief Compliance Officer
Download Q2 2023 Quarterly Update
Data is as of June 30, 2024, unless otherwise indicated. Returns for periods greater than one year are annualized. Past performance does not predict future returns and there can be no assurance that the fund will achieve results to those of any of Blackstone Credit & Insurance’s prior funds or be able to implement its strategy or achieve its investment objectives, including due to an inability to access sufficient investment opportunities.
- Annualized Distribution Yield reflects June’s distribution annualized and divided by last reported NAV from May. Distributions are not guaranteed. Past performance is not necessarily indicative of future results. Distributions have been and may in the future be funded through sources other than cash flow. See BCRED’s prospectus. Please visit the Shareholders page for notices regarding distributions subject to Section 19(a) of the Investment Company Act of 1940. We cannot guarantee that we will make distributions, and if we do we may fund such distributions from sources other than cash flow from operations, including the sale of assets, borrowings, return of capital, or offering proceeds, and although we generally expect to fund distributions from cash flow from operations, we have not established limits on the amounts we may pay from such sources. As of June 30, 2023, 100% of inception to date distributions were funded from cash flows from operations. A return of capital (1) is a return of the original amount invested, (2) does not constitute earnings or profits and (3) will have the effect of reducing the basis such that when a shareholder sells its shares the sale may be subject to taxes even if the shares are sold for less than the original purchase price. Distributions may also be funded in significant part, directly or indirectly, from temporary waivers or expense reimbursements borne by the Adviser or its affiliates, that may be subject to reimbursement to the Adviser or its affiliates. The repayment of any amounts owed to our affiliates will reduce future distributions to which you would otherwise be entitled. Annualized Distribution Yield for other share classes are as follows: 9.3% for Class S and 9.9% for Class D.
- Total Net Return is calculated as the change in NAV per share during the period, plus distributions per share (assuming dividends and distributions are reinvested) divided by the beginning NAV per share. Returns greater than one year are annualized. Inception to date (ITD) total return for Class S (no/with upfront placement fee): 8.1%/6.6%. ITD total return for Class D (no/with upfront placement fee): 7.9%/7.1%. Year to Date (YTD) total return for Class S (no/with upfront placement fee): 5.9%/2.2%. YTD total return for Class D (no/with upfront placement fee): 6.2%/4.6%. All returns shown are derived from unaudited financial information and are net of all BCRED expenses, including general and administrative expenses, transaction related expenses, management fees, incentive fees, and share class specific fees, but exclude the impact of early repurchase deductions on the repurchase of shares that have been outstanding for less than one year. Past performance is historical and not a guarantee of future results. Class D and Class S listed as (With Upfront Placement Fee or Brokerage Commissions) reflect the returns after the maximum upfront placement fees. Class D and Class S listed as (No Upfront Placement Fee or Brokerage Commissions) exclude upfront placement fees. Class I does not have upfront placement fees. The returns have been prepared using unaudited data and valuations of the underlying investments in BCRED’s portfolio, which are estimates of fair value and form the basis for BCRED ’s NAV. Valuations based upon unaudited reports from the underlying investments may be subject to later adjustments, may not correspond to realized value and may not accurately reflect the price at which assets could be liquidated.
- As a percentage of BCRED’s investment portfolio excluding equity investments in joint ventures, which have similar portfolio composition and underlying qualities. Compared to ratio of senior secured investments of 84% for BDC Peers. BDC Peers represented by the average share of investment portfolio in senior secured assets, weighted by total net asset value and using latest reported financials as of March 31, 2023. Ratio of senior secured investments excludes equity investments in unconsolidated joint ventures and separately managed accounts. BDC Peers included traded and non-traded BDCs. Traded BDCs include all those which are externally-managed with market capitalizations in excess of $750 million as of December 31, 2022 (excluding BXSL, which is managed by Blackstone Credit like BCRED and has significant overlap in its investments with BCRED): ARCC, FSK, PSEC, GBDC, GSBD, TSLX, NMFC, OCSL, BBDC, BCSF, OBDC and SLRC. Non-traded BDCs include perpetual funds which are externally-managed, had effective registration statements as of 2022 and were actively fundraising (based on Blackstone market research), have broad exposure across industries in their investments and not sector-focused, and had net asset values in excess of $2 billion as of December 31, 2022: Blue Owl Credit Income Corporation, HPS Corporate Lending Fund, and Apollo Debt Solutions.
- Includes all private debt investments for which fair value is determined by BCRED’s Board of Trustees (the “Board”) in conjunction with a third-party valuation firm and excludes quoted assets and may reflect a normalized or adjusted amount. Average loan-to-value represents the net ratio of loan-to-value for each such portfolio company, weighted based on the fair value of total applicable BCRED private debt investments. Loan-to-value is calculated as the current total net debt through each respective loan tranche divided by the estimated enterprise value of the portfolio company as of the most recent quarter end. See BCRED’s prospectus.
- Calculated as 1 minus loan-to-value.
- As a percentage of BCRED’s investment portfolio excluding equity investments in joint ventures, which have similar portfolio composition and underlying qualities.
- Includes all privately originated deals funded in respective quarters. Q4 2021 and Q2 2023 represent periods of contrasting base rates. Yields reflect average spread and origination fees or OID (amortized over 3 years) of private deals completed during respective quarters. On average, in Q4 2021, new investments had 0.8% base rate / floor and 6.3% spread and origination fees while in Q2 2023, new investments had 5.3% base rate and 7.1% spread and origination fees.
- Portfolio Earnings Yield represents Net Investment Income Return On Equity which is defined as the net income earned on investments attributable to BCRED Class I shareholders and is calculated as annualized quantity of net investment income earned by the portfolio of assets in the quarter divided by March 31, 2023 net asset value. Net Investment Income Return On Equity for other share classes is as follows: 11.8% for Class S and 12.4% for Class D.
- Includes all private debt investments for which fair value is determined by BCRED’s Board of Trustees (the “Board”) in conjunction with a third-party valuation firm and excludes quoted assets. Amounts are weighted on fair market value of each respective investment. Amounts were derived from the most recently available portfolio company financial statements, have not been independently verified by BCRED, and may reflect a normalized or adjusted amount. Accordingly, BCRED makes no representation or warranty in respect of this information. EBITDA is a non-GAAP financial measure. For a particular portfolio company, LTM (“last twelve month”) EBITDA is generally defined as net income before net interest expense, income tax expense, depreciation and amortization over the preceding 12-month period. Currency fluctuations may have an adverse effect on the value, price or income and costs of our portfolio companies and investments which may increase or decrease as a result of changes in exchange rates.
- Industry standard represented as the average LTM EBITDA of issuer companies of loans in the Lincoln International Private Market Database as of March 31, 2023.
- Some of the investments may be considered to have speculative characteristics. See Summary of Risk Factors in BCRED’s Prospectus for more information.
- Source: Lincoln International.
- Portfolio company cash flows have increased 20% on average since funding of each loan, which has led to average deleveraging of 0.7x. Portfolio companies funded in 2021 experienced a 20% increase in EBITDA since funding of each deal while portfolio companies funded in 2022 experienced a 16% increase in EBITDA since funding. Includes all private debt investments for which fair value is determined by the Board in conjunction with a third-party valuation firm and excludes quoted assets. Amounts derived from the most recently available portfolio company financial statements, have not been independently verified by BCRED, may reflect a normalized or adjusted amount, and are generally about 90 days in arrears. Accordingly, BCRED makes no representation or warranty in respect of this information.
- Average growth in LTM EBITDA for each respective portfolio company is weighted on fair market value of each respective investment. Includes all private debt investments for which fair value is determined by the Board in conjunction with a third-party valuation firm and excludes quoted assets. Amounts derived from the most recently available portfolio company financial statements, have not been independently verified by BCRED, may reflect a normalized or adjusted amount, and are generally about 90 days in arrears. Accordingly, BCRED makes no representation or warranty in respect of this information. Industry standard represented as the median LTM EBITDA growth year-over-year of issuer companies of loans in the Lincoln International Private Market Database as of 1Q’23. BCRED’s year-over-year growth in LTM EBITDA of 10% compared to industry standard of 5%.
- Free cash flow conversion is estimated as EBITDA less capital expenditures, divided by EBITDA for each respective portfolio company and is weighted on fair market value of each respective investment. Includes all private debt investments for which fair value is determined by the Board in conjunction with a third-party valuation firm and excludes quoted assets. Amounts derived from the most recently available portfolio company financial statements, have not been independently verified by BCRED, may reflect a normalized or adjusted amount, and are generally about 90 days in arrears. Accordingly, BCRED makes no representation or warranty in respect of this information. EBITDA, capital expenditures and free cash flow conversion are non-GAAP financial measures. BCRED’s free cash flow conversion rate was 86% compared to industry standard of 65%, which is represented by the ratio of average LTM adjusted EBITDA less average LTM capital expenditures, divided by average LTM adjusted EBITDA for leveraged loan borrowers, as reported by J.P. Morgan in 1Q’23.
- Interest coverage ratio is defined as operating profit, or LTM EBITDA, divided by interest expense for each respective portfolio company. Includes all private debt investments for which fair value is determined by the Board in conjunction with a third-party valuation firm and excludes quoted assets. EBITDA is a non-GAAP financial measures. For a particular portfolio company, EBITDA is generally defined as net income before net interest expense, income tax expense, depreciation, and amortization. Amounts derived from the most recently available portfolio company financial statements, have not been independently verified by BCRED, may reflect a normalized or adjusted amount, and are generally about 90 days in arrears. Accordingly, BCRED makes no representation or warranty in respect of this information. 4% of BCRED’s investments have less than 1.0x interest coverage ratio.
- As of June 30, 2023 as assessed through today. Calculated as the amortized cost of loans on non-accrual divided by total amortized cost of the BCRED portfolio excluding investments in joint ventures. Based on the fair market value of the BCRED portfolio excluding investments in joint ventures, BCRED’s non-accrual rate is 0.2%. Loans are generally placed on non-accrual status when there is reasonable doubt whether principal or interest will be collected in full. Accrued interest is generally reversed when a loan is placed on non-accrual status. Additionally, any original issue discount and market discount are no longer accreted to interest income as of the date the loan is placed on non-accrual status. Interest payments received on non-accrual loans may be recognized as income or applied to principal depending upon management’s judgment regarding collectability. Non-accrual loans are restored to accrual status when past due principal and interest is paid current and, in management’s judgment, are likely to remain current. Management may make exceptions to this treatment and determine to not place a loan on non-accrual status if the loan has sufficient collateral value and is in the process of collection.
- Peer set or BDC Peers is represented by the peer average non-accrual rate as of March 31, 2023, weighted by total net asset value. Non-accrual rate is calculated for each BDC as the amortized cost of loans on non-accrual status divided by total amortized cost of the investment portfolio. Based on the fair market value of BDC Peers, the BDC Peers non-accrual rate is 1.0%. Non-accrual status of a given loan is self-reported by each BDC and is intended to indicate when there is reasonable doubt that said loan’s principal or interest will be collected in full. BDC Peers included traded and non-traded BDCs. Traded BDCs include all those which are externally-managed with market capitalizations in excess of $750 million as of December 31, 2022 (excluding BXSL, which is managed by Blackstone Credit like BCRED and has significant overlap in its investments with BCRED): ARCC, FSK, PSEC, GBDC, GSBD, TSLX, NMFC, OCSL, BBDC, BCSF, OBDC and SLRC. Non-traded BDCs include perpetual funds which are externally-managed, had effective registration statements as of 2022 and were actively fundraising (based on Blackstone market research), have broad exposure across industries in their investments and not sector-focused, and had net asset values in excess of $2 billion as of December 31, 2022: Blue Owl Credit Income Corporation, HPS Corporate Lending Fund, and Apollo Debt Solutions.
- Data is based on opportunities reviewed by Blackstone Credit from January 1, 2023, to June 30, 2023, that Blackstone Credit categorized as North America Performing Credit privately originated transactions (which constitute the majority of BCRED’s portfolio) and on which Blackstone Credit made a final decision to invest, actually invested, or declined. The following potential investment opportunities are not included in this data: potential investments that Blackstone Credit was still considering as of June 30, 2023, investments that BCRED made during the relevant period but that are not categorized as North America Performing Credit (for example, Mezzanine debt and European direct lending), and add-ons or follow-ons to existing investments. Accordingly, the percentage of all transactions considered by Blackstone Credit for BCRED during this period and in which Blackstone ultimately invested (i.e., including deals not categorized as North America Performing Credit) exceeds the figure presented here.
- Blackstone Credit has invested nearly $89 billion across the North America Direct Lending track record over the last 17 years as of March 31, 2023, with an annualized realized loss rate of 0.11% as of June 30, 2023. The North America Direct Lending track record represents U.S. and Canada first lien and unitranche debt (which may be secured by the applicable borrower’s assets and/or equity) transactions in companies that were originated or anchored by certain Blackstone Credit managed, advised or sub-advised funds, Blackstone Credit managed mezzanine funds and Blackstone Credit advised business development companies (such advised business development companies, the “BDCs”), as well as certain other Blackstone Credit managed funds and accounts) and, with respect to certain transactions, investments allocated to affiliates of Blackstone Credit, which may be sold to Blackstone Credit managed funds or accounts in the future, since 2006. The track record includes investments for periods prior to December 31, 2017, in BDCs that were sub-advised by Blackstone Credit on a non-discretionary basis until April 9, 2018 (the “Sub-Advised Investments”). With respect to certain transactions, the North America Direct Lending track record includes free equity and/or warrants that accompanied the debt financings, as well as any loans or securities into which the applicable first lien and unitranche debt may have been restructured subsequent to Blackstone Credit’s initial investment. The North America Direct Lending track record excludes (i) broadly syndicated, mezzanine, second lien and equity (other than the aforementioned free equity and/or warrants or securities issued upon restructuring) transactions, among others and (ii) transactions where Blackstone Credit’s invested capital (net of transactions fees) was under $25 million.
- The realized loss rate represents annualized net losses for substantially realized investments. Whether an investment is substantially realized is determined in the manager’s discretion. Investments are included in the loss rate if (1) a payment was missed, (2) bankruptcy was declared, (3) there was a restructuring, or (4) it was realized with a total multiple on invested capital less than 1.0x. Net losses include all profits and losses associated with these investments, including interest payments received. Net losses are represented in the year the investment is substantially realized and excludes all associated with unrealized investments. The annualized net loss rate is the net losses divided by the average annual remaining invested capital within the platform. Investments sourced by Blackstone Credit for the Sub-Advised Investments did, in certain cases, experience defaults and losses after Blackstone Credit was no longer sub-adviser, and such defaults and losses are not included in the rates provided. Prior to March 31, 2023, the methodology used by the North America Direct Lending track record for calculating the platform’s average annual loss rate was based on net loss of principal resulting only from payment defaults in the year of default which would exclude interest payments.
- Reflects unique corporate issuers across funds and accounts managed by Blackstone Credit’s Liquid Credit Strategies and Private Credit Strategies groups.
- Senior Advisors are not Blackstone employees. There can be no assurance that such professionals will be associated with the fund throughout the life of the fund. The level of involvement and role of the advisors with each Blackstone portfolio company may vary, including having no involvement or role at all.
- Numbers presented are since inception of the Value Creation program in 2016, and is not limited to investments made to BCRED portfolio companies, which may have lower figures. Data presented is based on internal Blackstone data recorded and not from financial statements of portfolio companies. Value creation represents ~$284 million of annual savings as of June 30, 2023, representing annualized estimated savings utilizing the Blackstone Value Creation program at the time cost is benchmarked with portfolio companies. Savings improved portfolio company EBITDA and created value assuming a 12x average EBITDA multiple. A portion of these savings and implied enterprise value creation have benefited certain BCRED portfolio companies.
- Please see “Index Definitions” and “Index Comparison” at the end of this communication for more information. Source: Morningstar, Blackstone Credit as of June 30, 2023. “Leveraged Loans” is represented by Morningstar LSTA US Leveraged Loan Index. “High Yield Bonds” is represented by the Bloomberg US Corporate High Yield Index. “Investment Grade Bonds” is represented by the Bloomberg US Aggregate Bond Index. There can be no assurances that any of the trends described throughout this letter will continue or will not reverse.
Important Disclosure Information
Local, regional or global events such as war (e.g., Russia/Ukraine), acts of terrorism, public health issues like pandemics or (e.g., COVID-19), recessions, or other economic, political and global macro factors and events could lead to a substantial economic downturn or recession in the U.S. and global economies and have a significant impact on the Fund and its investments. The recovery from such downturns is uncertain and may last for an extended period of time or result in significant volatility, and many of the risks discussed herein associated with an investment in the Fund may be increased.
Summary of Risk Factors
Blackstone Private Credit Fund (“BCRED”) is a non-exchange traded business development company (“BDC”) that expects to invest at least 80% of its total assets (net assets plus borrowings for investment purposes) in private credit investments (loans, bonds and other credit instruments that are issued in private offerings or issued by private companies). This investment involves a high degree of risk. You should purchase these securities only if you can afford the complete loss of your investment. You should read the prospectus carefully for a description of the risks associated with an investment in BCRED. These risks include, but are not limited to, the following:
- We have limited prior operating history and there is no assurance that we will achieve our investment objectives.
- This is a “blind pool” offering and thus you will not have the opportunity to evaluate our investments before we make them.
- You should not expect to be able to sell your shares regardless of how we perform.
- You should consider that you may not have access to the money you invest for an extended period of time.
- We do not intend to list our shares on any securities exchange, and we do not expect a secondary market in our shares to develop prior to any listing.
- Because you may be unable to sell your shares, you will be unable to reduce your exposure in any market downturn.
- We have implemented a share repurchase program, but only a limited number of shares will be eligible for repurchase and repurchases will be subject to available liquidity and other significant restrictions.
- An investment in our common shares is not suitable for you if you need access to the money you invest. See “Suitability Standards” and “Share Repurchase Program” in the prospectus.
- You will bear substantial fees and expenses in connection with your investment. See “Fees and Expenses” in the prospectus.
- We cannot guarantee that we will make distributions, and if we do, we may fund such distributions from sources other than cash flow from operations, including the sale of assets, borrowings, return of capital or offering proceeds, and although we generally expect to fund distributions from cash flow from operations, we have not established limits on the amounts we may pay from such sources. A return of capital (1) is a return of the original amount invested, (2) does not constitute earnings or profits and (3) will have the effect of reducing the basis such that when a shareholder sells its shares the sale may be subject to taxes even if the shares are sold for less than the original purchase price.
- Distributions may also be funded in significant part, directly or indirectly, from temporary waivers or expense reimbursements borne by Blackstone Credit BDC Advisers (the “Adviser”) or its affiliates, that may be subject to reimbursement to the Adviser or its affiliates. The repayment of any amounts owed to our affiliates will reduce future distributions to which you would otherwise be entitled.
- We use and continue to expect to use leverage, which will magnify the potential for loss on amounts invested in us.
- We intend to invest in securities that are rated below investment grade by rating agencies or that would be rated below investment grade if they were rated. Below investment grade securities, which are often referred to as “junk,” have predominantly speculative characteristics with respect to the issuer’s capacity to pay interest and repay principal. They may also be illiquid and difficult to value.
- We do not own the Blackstone name, but we are permitted to use it as part of our corporate name pursuant to the investment advisory agreement between BCRED and an affiliate of Blackstone Inc. (“Blackstone”). Use of the name by other parties or the termination of the use of the Blackstone name under the investment advisory agreement may harm our business.
Neither the Securities and Exchange Commission nor any state securities regulator has approved or disapproved of these securities or determined if the prospectus is truthful or complete. Any representation to the contrary is unlawful.
This website must be read in conjunction with the BCRED prospectus in order to fully understand all the implications and risks of an investment in BCRED. This website is neither an offer to sell nor a solicitation of an offer to buy securities. An offering is made only by the prospectus, which must be made available to you prior to making a purchase of shares in connection with this offering and is available at https://www.bcred.com/prospectus. Prior to making an investment, investors should read the prospectus, including the “Risk Factors” section therein, which contains a discussion of the risks and uncertainties that we believe are material to our business, operating results, prospects and financial condition.
Numerical data is approximate and as of June 30, 2024, unless otherwise noted. The words “we”, “us”, and “our” refer to BCRED, unless the context requires otherwise.
Forward-Looking Statement Disclosure
Certain information contained in this communication constitutes “forward-looking statements” within the meaning of the federal securities laws and the Private Securities Litigation Reform Act of 1995. These forward-looking statements can be identified by the use of forward-looking terminology, such as “outlook,” “indicator,” “believes,” “expects,” “potential,” “continues,” “may,” “can,” “will,” “should,” “seeks,” “approximately,” “predicts,” “intends,” “plans,” “estimates,” “anticipates”, “confident,” “conviction,” “identified” or the negative versions of these words or other comparable words thereof. These may include BCRED’s financial estimates and their underlying assumptions, statements about plans, objectives and expectations with respect to future operations, statements regarding future performance, statements regarding economic and market trends and statements regarding identified but not yet closed investments. Such forward‐looking statements are inherently subject to various risks and uncertainties. Accordingly, there are or will be important factors that could cause actual outcomes or results to differ materially from those indicated in such statements. BCRED believes these factors include but are not limited to those described under the section entitled “Risk Factors” in its prospectus and annual report for the most recent fiscal year, and any such updated factors included in its periodic filings with the Securities and Exchange Commission (the “SEC”), which are accessible on the SEC’s website at www.sec.gov. These factors should not be construed as exhaustive and should be read in conjunction with the other cautionary statements that are included in this document (or BCRED’s prospectus and other filings). Except as otherwise required by federal securities laws, BCRED undertakes no obligation to publicly update or revise any forward-looking statements, whether as a result of new information, future developments or otherwise.
Blackstone Securities Partners L.P. (“BSP”) is a member of FINRA and is a broker-dealer whose purpose is to distribute Blackstone managed or affiliated products. BSP provides services to its Blackstone affiliates, not to investors in its funds, strategies or other products. BSP does not make any recommendation regarding, and will not monitor, any investment. As such, when BSP presents an investment strategy or product to an investor, BSP does not collect the information necessary to determine—and BSP does not engage in a determination regarding—whether an investment in the strategy or product is in the best interests of, or is suitable for, the investor. You should exercise your own judgment and/or consult with a professional advisor to determine whether it is advisable for you to invest in any Blackstone strategy or product. Please note that BSP may not provide the kinds of financial services that you might expect from another financial intermediary, such as overseeing any brokerage or similar account. For financial advice relating to an investment in any Blackstone strategy or product, contact your own professional advisor.
Index Definitions
The Cliffwater Direct Lending Index (CDLI) seeks to measure the unlevered, gross of fee performance of US middle market corporate loans, as represented by the asset-weighted performance of the underlying assets of Business Development Companies (BDCs), including both exchange-traded and unlisted BDCs, subject to certain eligibility requirements.
Morningstar LSTA US Leveraged Loan Index is a market value-weighted index designed to measure the performance of the US leveraged loan market based upon market weightings, spreads and interest payments.
Bloomberg US Corporate High Yield Index measures the USD-denominated, high yield, fixed-rate corporate bond market. Securities are classified as high yield if the middle rating of Moody’s, Fitch and S&P is Ba1/BB+/BB+ or below.
Bloomberg US Treasury Index is a rules-based, market-value weighted index engineered to measure the performance and characteristics of fixed rate coupon US Treasuries which have a maturity greater than 12 months. To be included in the index a security must have a minimum par amount of $1 billion.
Bloomberg US Aggregate Bond Index represents securities that are SEC-registered, taxable, and dollar denominated. The index covers the US investment grade fixed rate bond market, with index components for government and corporate securities, mortgage pass-through securities, and asset-backed securities. These major sectors are subdivided into more specific indices that are calculated and reported on a regular basis.
Index Comparison. The volatility and risk profile of the indices presented in this document is likely to be materially different from that of the Fund. In addition, the indices employ different investment guidelines and criteria than the Fund and do not employ leverage; as a result, the holdings in the Fund and the liquidity of such holdings may differ significantly from the securities that comprise the indices. The indices are not subject to fees or expenses and it may not be possible to invest in the indices. A summary of the investment guidelines for the indices presented are available upon request.